异常值
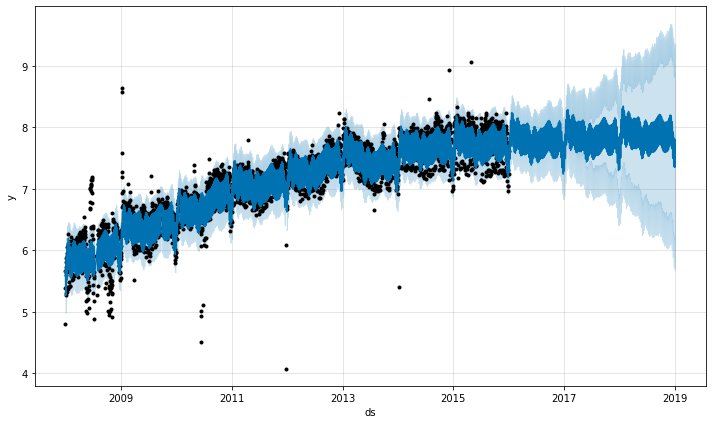
异常值主要通过两种方式影响 Prophet 预测。 在这里,我们对之前记录的 Wikipedia 访问 R 页面的数据进行预测,但包含一段错误数据
1
2
3
4
5
6
# R
df <- read.csv('https://raw.githubusercontent.com/facebook/prophet/main/examples/example_wp_log_R_outliers1.csv')
m <- prophet(df)
future <- make_future_dataframe(m, periods = 1096)
forecast <- predict(m, future)
plot(m, forecast)
1
2
3
4
5
6
7
# Python
df = pd.read_csv('https://raw.githubusercontent.com/facebook/prophet/main/examples/example_wp_log_R_outliers1.csv')
m = Prophet()
m.fit(df)
future = m.make_future_dataframe(periods=1096)
forecast = m.predict(future)
fig = m.plot(forecast)
趋势预测看起来合理,但不确定性区间似乎太宽了。 Prophet 能够处理历史记录中的异常值,但只能通过拟合趋势变化来处理。 然后,不确定性模型期望未来出现类似幅度的趋势变化。
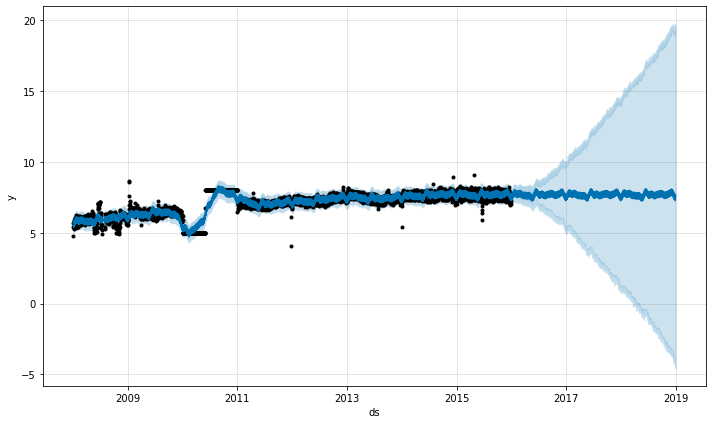
处理异常值的最佳方法是删除它们 - Prophet 在处理缺失数据方面没有问题。 如果你在历史记录中将它们的值设置为 NA,但在 future 中保留日期,那么 Prophet 将为你提供其值的预测。
1
2
3
4
5
6
7
# R
outliers <- (as.Date(df$ds) > as.Date('2010-01-01')
             & as.Date(df$ds) < as.Date('2011-01-01'))
df$y[outliers] = NA
m <- prophet(df)
forecast <- predict(m, future)
plot(m, forecast)
1
2
3
4
# Python
df.loc[(df['ds'] > '2010-01-01') & (df['ds'] < '2011-01-01'), 'y'] = None
model = Prophet().fit(df)
fig = model.plot(model.predict(future))
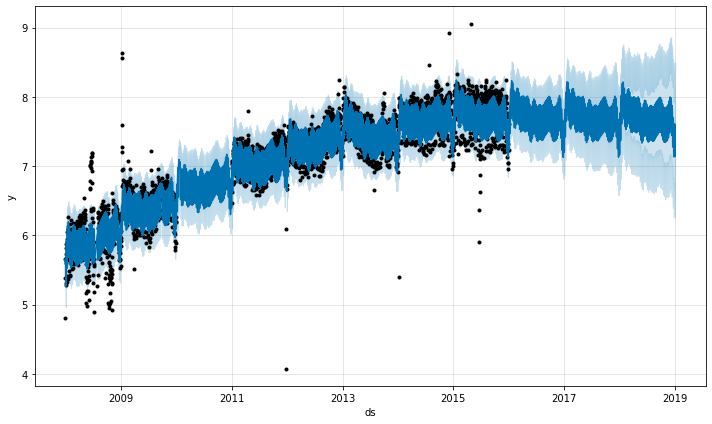
在上面的例子中,异常值搞砸了不确定性估计,但没有影响主要的预测 yhat。 并非总是如此,例如在这个添加了异常值的例子中
1
2
3
4
5
6
# R
df <- read.csv('https://raw.githubusercontent.com/facebook/prophet/main/examples/example_wp_log_R_outliers2.csv')
m <- prophet(df)
future <- make_future_dataframe(m, periods = 1096)
forecast <- predict(m, future)
plot(m, forecast)
1
2
3
4
5
6
7
# Python
df = pd.read_csv('https://raw.githubusercontent.com/facebook/prophet/main/examples/example_wp_log_R_outliers2.csv')
m = Prophet()
m.fit(df)
future = m.make_future_dataframe(periods=1096)
forecast = m.predict(future)
fig = m.plot(forecast)
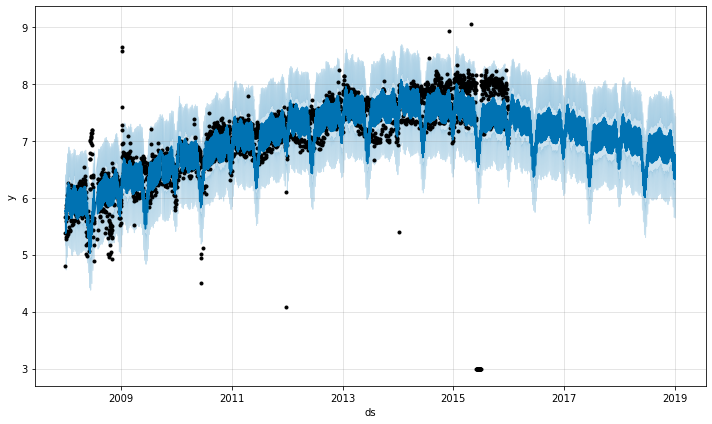
在这里,2015 年 6 月的一组极端异常值搞砸了季节性估计,因此它们的影响会永远延续到未来。 同样,正确的方法是删除它们
1
2
3
4
5
6
7
# R
outliers <- (as.Date(df$ds) > as.Date('2015-06-01')
             & as.Date(df$ds) < as.Date('2015-06-30'))
df$y[outliers] = NA
m <- prophet(df)
forecast <- predict(m, future)
plot(m, forecast)
1
2
3
4
# Python
df.loc[(df['ds'] > '2015-06-01') & (df['ds'] < '2015-06-30'), 'y'] = None
m = Prophet().fit(df)
fig = m.plot(m.predict(future))